Blog
Studying Air Pollution Levels In Delhi NCR During Lockdown Could Hold The Key To Better Air Quality
Delhi-NCR area is known to have some of the worst air pollution levels in the country all year round. While there are multiple factors such as geographical location, vehicular and industrial pollution, crop burning etc that make this area susceptible to high levels of air pollution, reduction in levels of the same also warrant for observation, to better understand what works and what doesn’t to better the air quality of any area.
During the lockdown triggered by COVID-19 pandemic and the resultant restrictions, a significant drop was observed in Delhi-NCR pollution. Could this decline in figures hold the key to cleaning up the Delhi air, and that of various cities across the nation? Could this be considered a controlled experiment where we remove a known set of air pollution sources and see the result in numbers?
To find that out, Airveda and Nagarro commissioned a study with Anmol Dureha, Bhairevi Aiyer, Gursehaj Aneja, Pranav Suri titled “Analysing Pollution Levels in Delhi NCR During the COVID-19 Lockdown,” which aims to critique or propose actionable steps to take in the post-COVID world to keep a check on the pollution levels.
The study analyses five different pollutants, Particulate Matter 2.5, Particulate Matter 10, Nitrogen Oxides, Ozone, Carbon Monoxide, with respect to their recommended levels. The data was obtained for each of the pollution-monitoring stations spread across Delhi NCR, using the Central Pollution Control Board website.
The lockdown was divided into four phases, associated with different levels of economic activity:
Phase-1 (25 Mar - 14 Apr) in which all services and factories except essential services were closed.
Phase-2 (15 Apr - 3 May) in which Agricultural businesses, Cargo transportation vehicles, banks and government centres and distributing benefits were allowed to open in non-containment zones.
Phase-3 (4 May - 17 May) in which public transport: buses, call centres and IT Services, e-commerce for essential goods, govt offices engaged inessential services, Private offices with 33% strength, Private 4 and 2-wheelers with 50% occupancy were allowed to open.
Phase-4 (18 May - 31 May) in which local markets, Government & private offices, taxis with two passengers, auto rickshaw with single passenger, and buses with 20 passengers, Construction activities, weekly markets, street, vendors, industrial units (with staggered business hours) were open, and marriages with guest upto 50 people and funerals upto 20 people were allowed.
Key Findings From The Study:
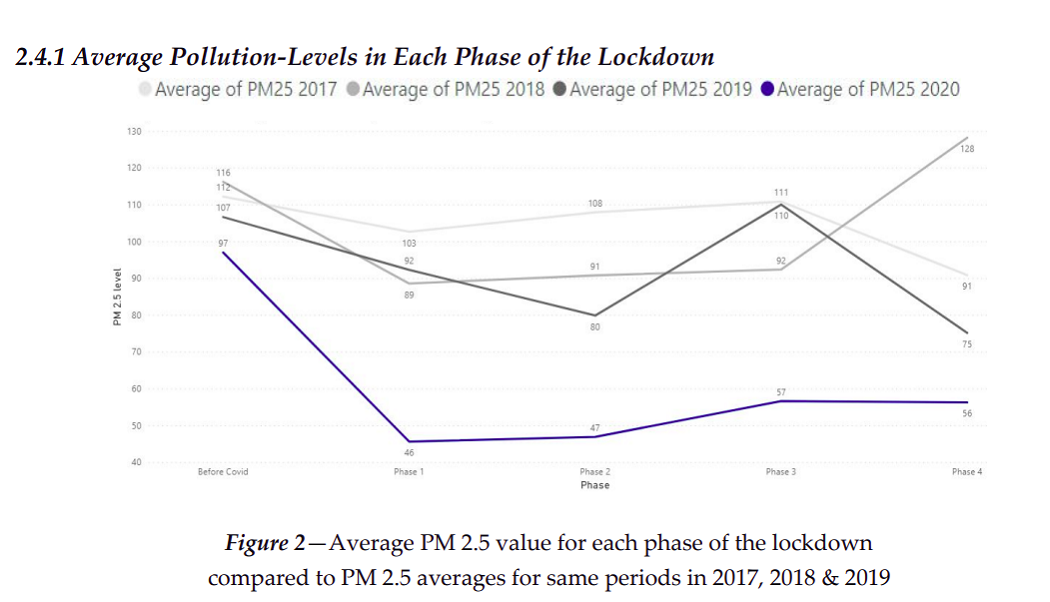
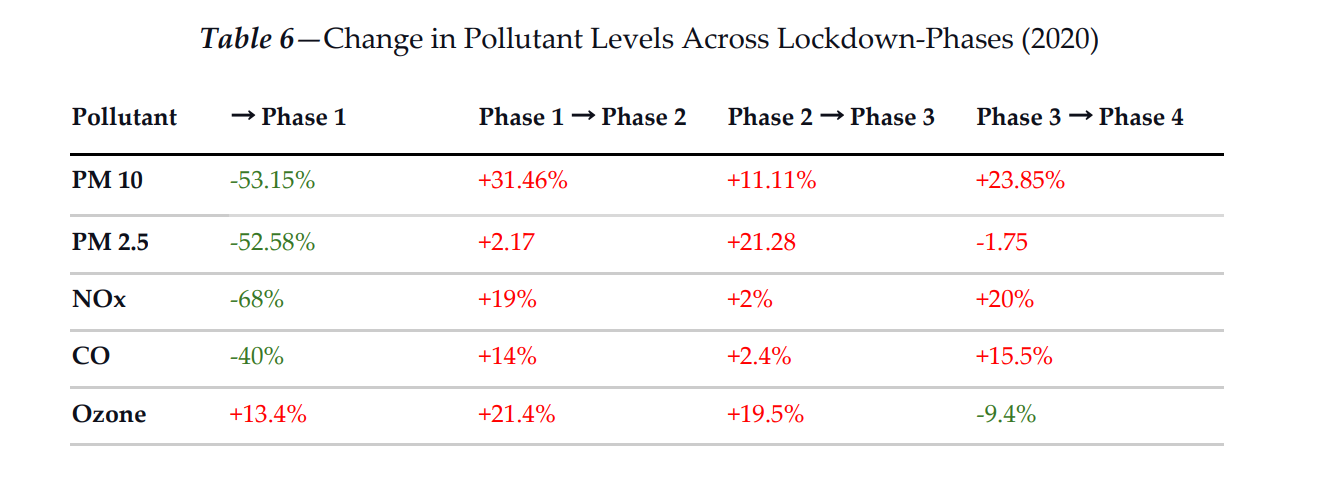
The study found that average PM 2.5 levels for 2020 improved from Moderate to Satisfactory approaching the first phase of the lockdown (with a sharp drop of 52% from Feb 1st to March 24th), and continued to stay within the Satisfactory levels throughout the lockdown. However, it shows a major increase of 20% from Phase-2 to Phase-3 of the lockdown.
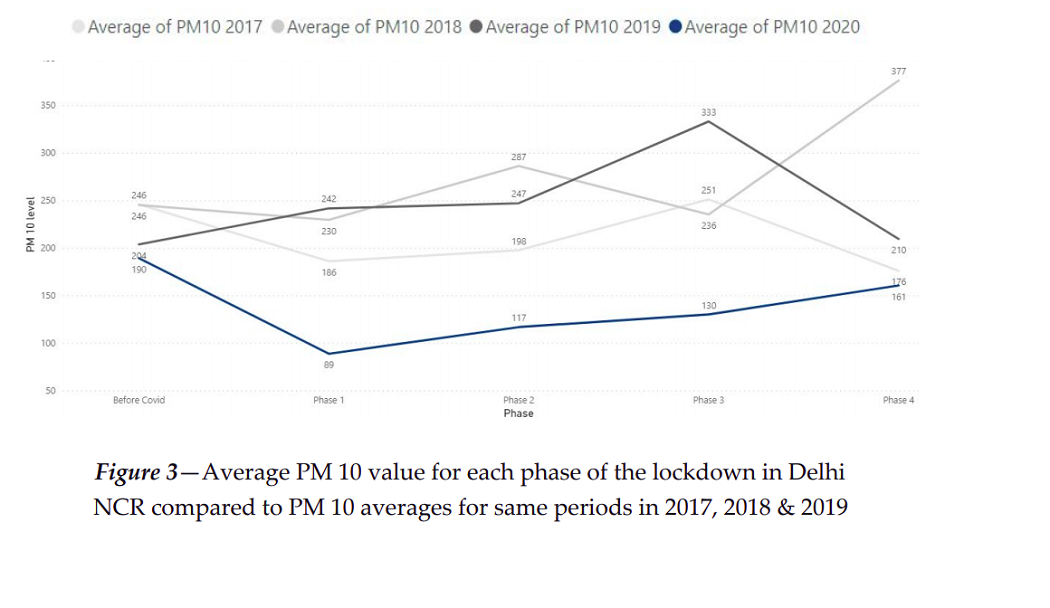
When it comes to average PM 10 level for 2020, the figures improved from Moderate to Satisfactory levels approaching the first phase of the lockdown (with a sharp drop of 53% from Feb 1st to March 24th). PM 10 levels increased consistently through the lockdown phases, showing increases of 31% from Phase-1 to Phase 2, and 23% from Phase-3 to Phase-4.
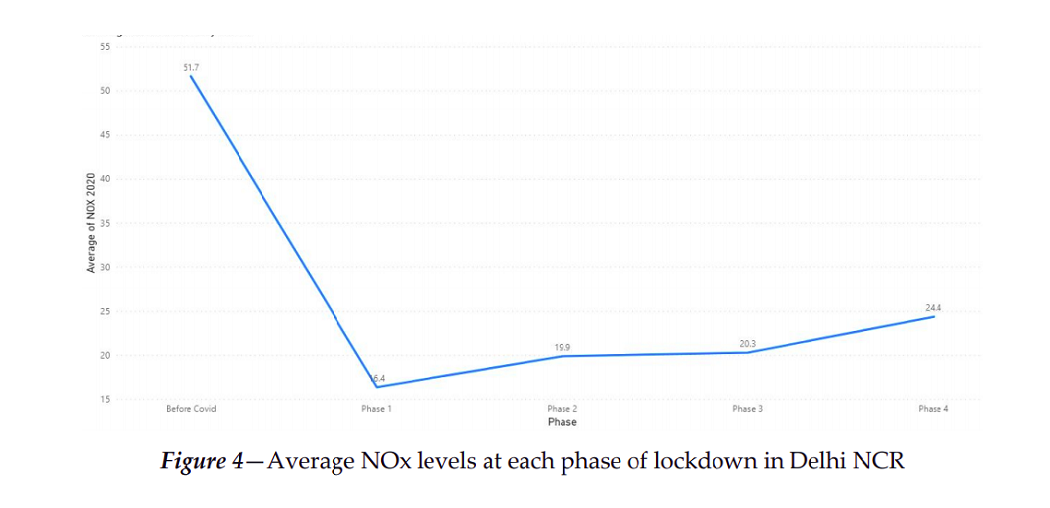
The average NO2 values decreased by 68% from Feb 01 to March 24, but then increased with every phase, by 19% from Phase-1 to Phase-2, and 20% from Phase-3 to Phase-4.
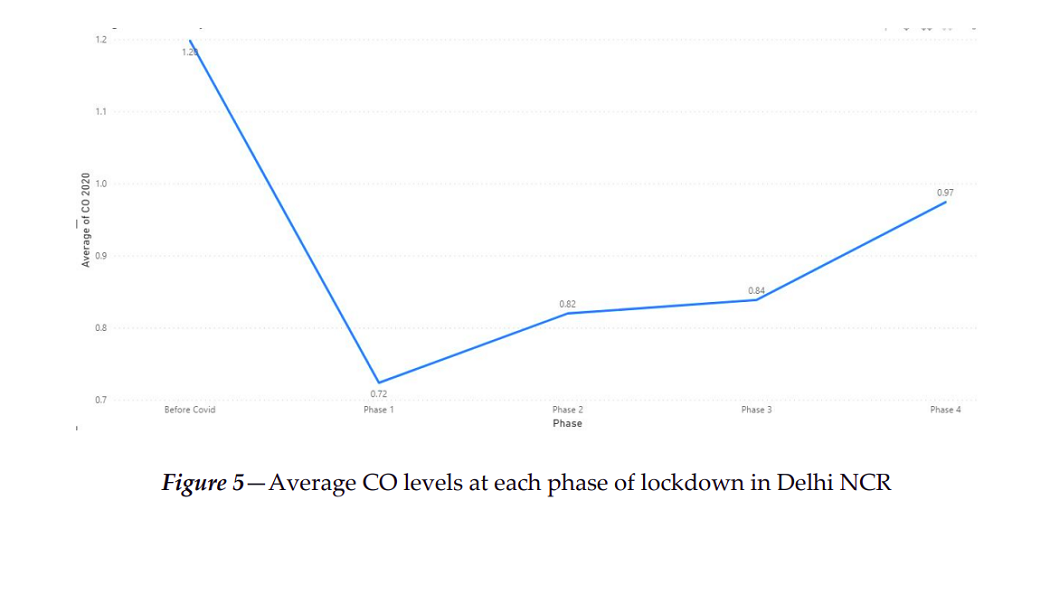
CO values too showed a decrease by 40% approaching the first lockdown, and then showed an increasing trend throughout the phases of the lockdown. However, throughout these 4 phases, the values remained below 1.0 ppm which was still in the Good range.
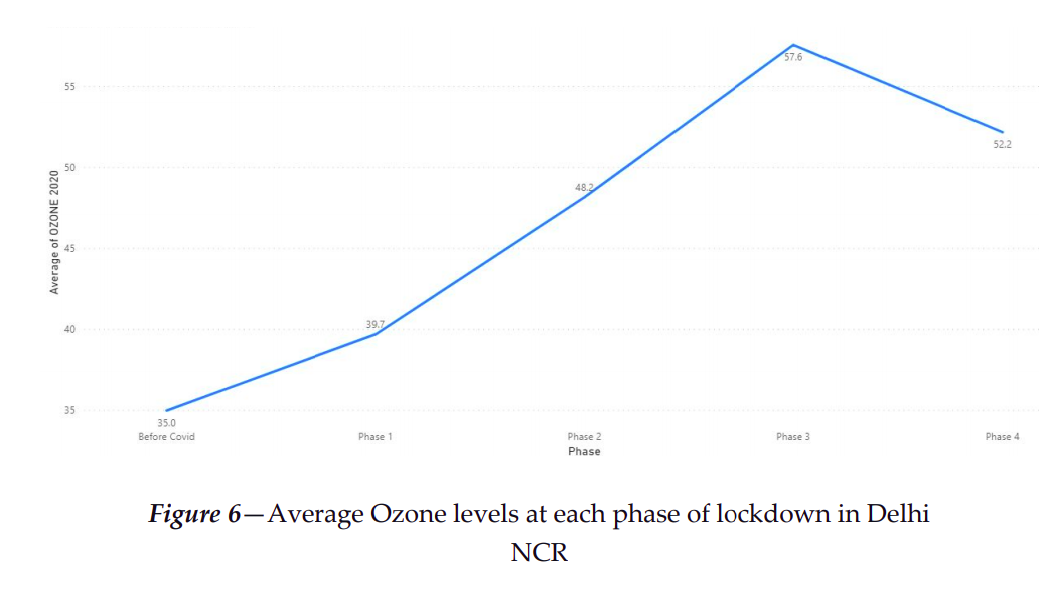
Ozone levels on the other hand showed an increasing trend from Phase 1, peaking in Phase 3 and then recording a dip in Phase 4. As per the researchers, this rise in Ozone levels could be because of increasing temperature during the lockdown. Being a photochemical oxidant, ozone’s production becomes more efficient during the summer . However, the reduction in levels after Phase-3 might be because of higher particulate matter concentration in Phase-4 of the lockdown as with higher particulate matter levels in air, the sunlight gets scattered which then reduces the ozone production.
The average pollution levels of PM 2.5, PM 10, NO2 and CO were at the lowest during Phase-1 and this could be because nearly all services and factories were suspended during the said phase. The sharp increase in PM 10 in Phase-2, however, can be attributed to two important events in the third week of April: crop burning occurring around NCR and a dust storm. The former could have caused an increase in NO2 levels too.

Comparison with previous years
One thing is for sure though, 2020 had much better quality throughout the 4 lockdown phases as compared to previous years.
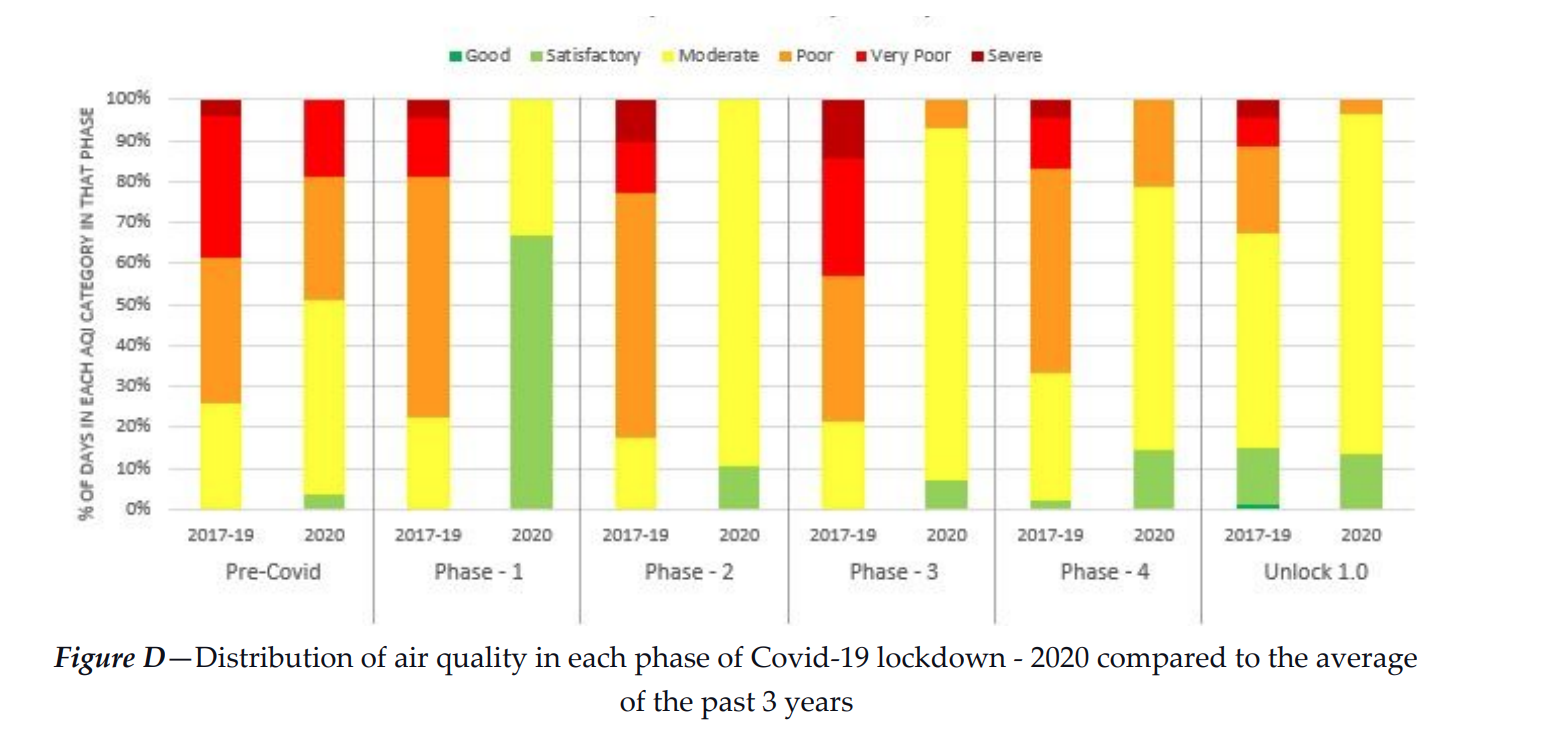
Days with satisfactory air quality grew from 0.5% to 27.9% in 2020
Days with moderate air quality grew from 22.6% to 66.2% in 2020
Days with poor/ very poor / severe air quality dropped from 76.96% to just 5.88% poor days and there were no very poor or severe days in 2020
Despite the reduced economic activity, we barely saw any good days in 2020.
However even before the lockdown during pre-covid period, we saw an improvement in air quality from 2017/2018/2019 to 2020
If we look at pre-covid values of PM2.5 and PM10 there was an improvement of about 22.8% from 2017 and 2018 and 6.8% from 2019. Similarly for PM10 there was a 13.4%, 16.4% and 9% improvement from 2017,2018 and 2019 respectively.
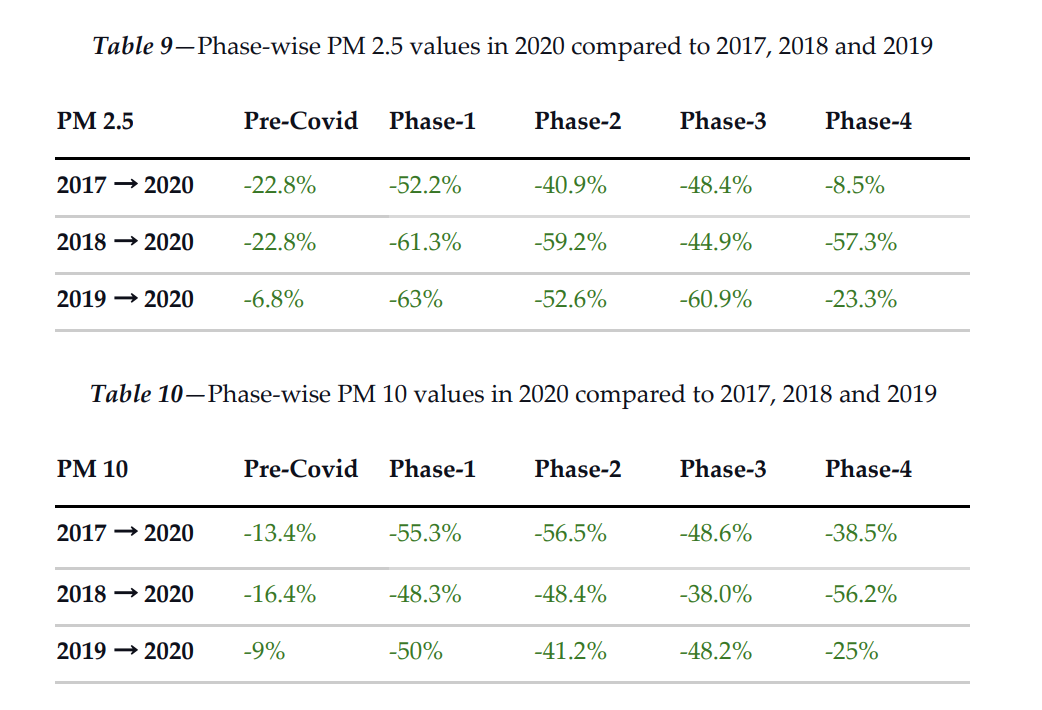
The decreases in these levels for 2020 can be associated with initiatives such as shifting from BS-IV fuel to BS-VI fuel, closing the Badarpur power plant, banning coal and kerosene in Delhi and strictness in industrial pollution regulation, taken by the Delhi government.
Air Quality improves under stricter control and not one-off events
On locally inspecting pollution trends, Aya Nagar and ITO regions, with noted high road traffic, exhibited a high correlation with air pollution levels as economic activity and traffic grew.
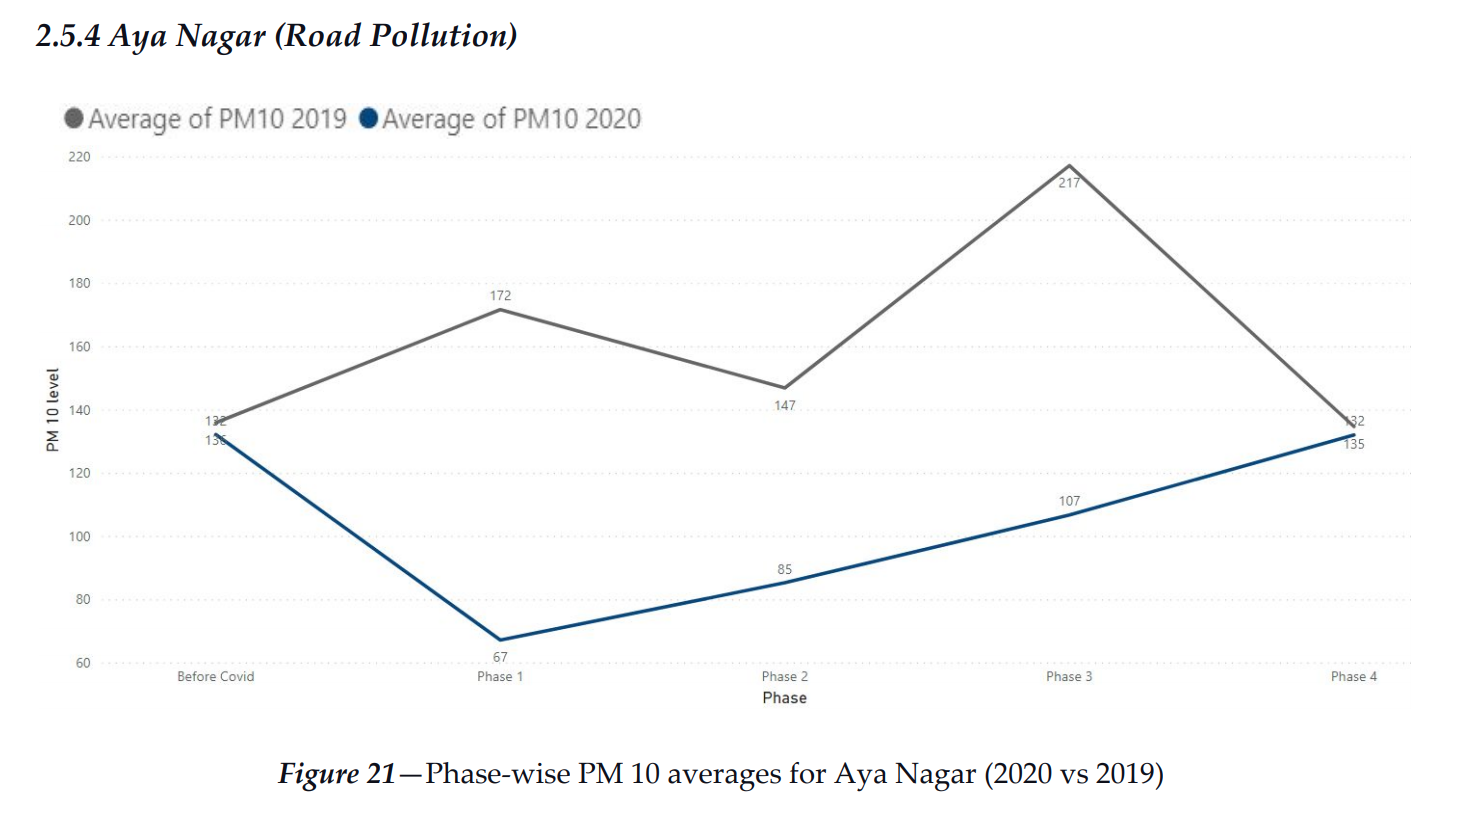
As seen in Figure 21, with the imposition of the lockdown, the majority of the cross-border traffic movement was restricted, leading to the dip in Phase-1. With ease of lockdown restrictions with each passing phase, the traffic increased and by Phase-4 the air pollution levels nearly reached the average value observed in 2019.
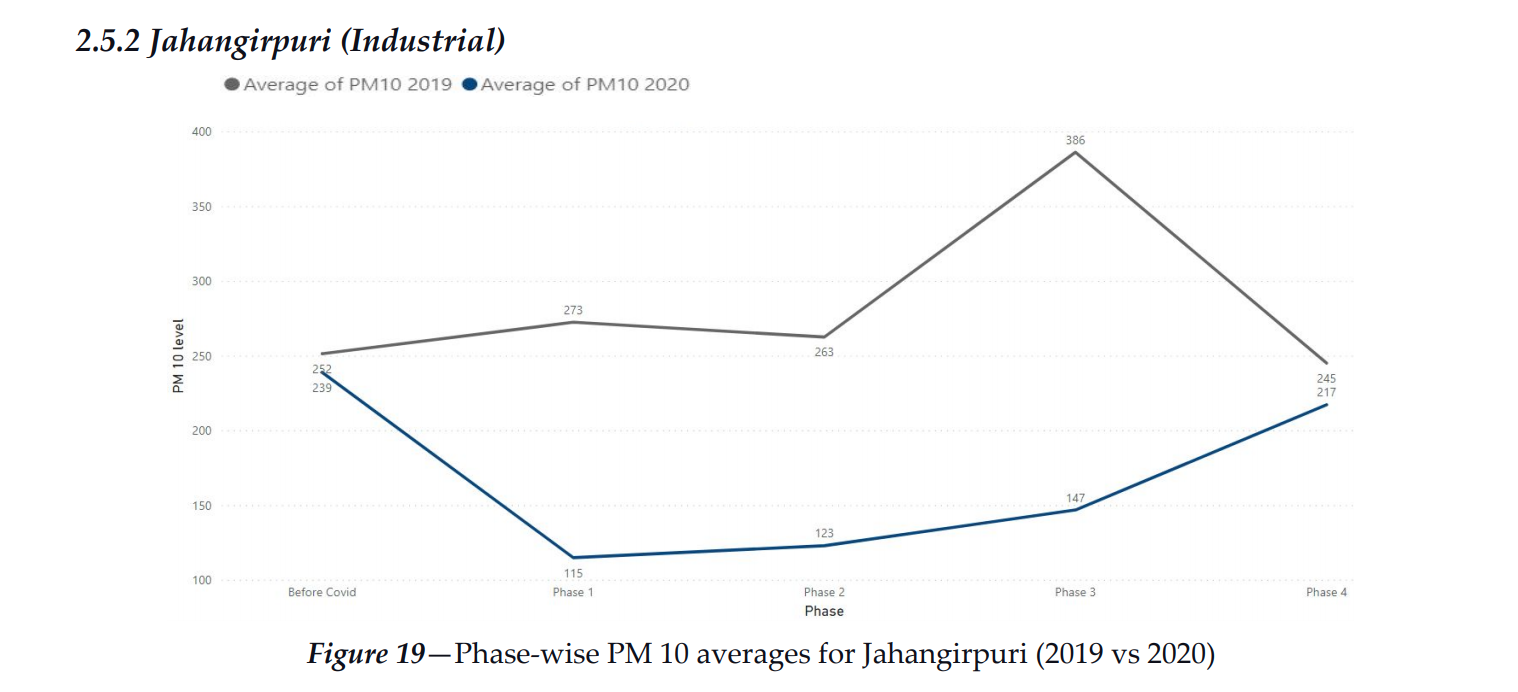
Further, in industrial areas like Jahangirpuri and Manesar (figure 19), they observed that lockdown significantly reduced pollution levels with industry shut-down in Phase-1. Resumption of industrial activities resulted in a sudden increase in air pollution levels of these areas almost reaching 2019 levels by Phase-4.
Moreover, it was noted that it takes at least two full days of reduced economic activity for particulate matter (PM 2.5 and PM 10) to drop to Satisfactory levels, and six to seven days to drop to minimum value. Therefore, these observations call for stricter regulations for the prevention or control of pollution such as or beyond what was implemented in 2018, and casts doubt on the effectiveness of one-off events themed around air pollution in Delhi NCR.
Conclusions
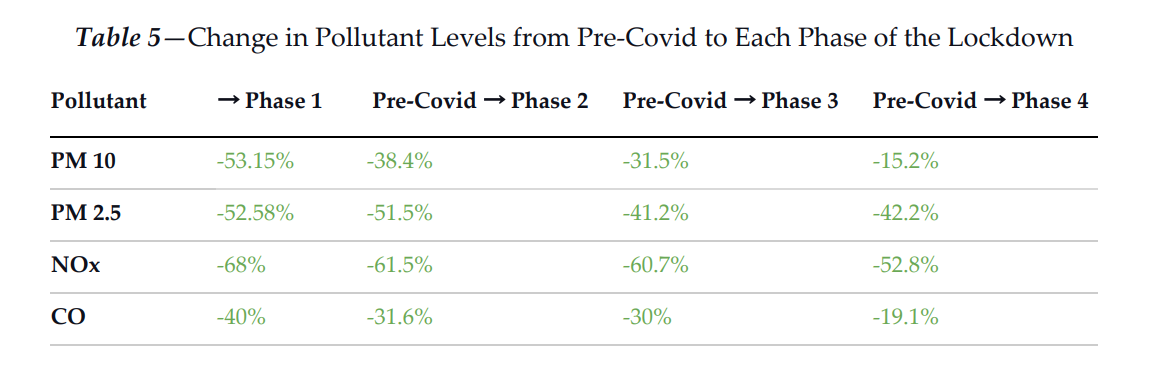
The researchers observed a drop in pollution amounting to more than 50% for Phase-1 of the lockdown, as compared to the previous years, for the same time period. Across the phases, the average drop in pollution is 30%. This implied that with strict controls and measures, air quality can be improved.
In conclusion, there are four main takeaways from this study, to be considered and acted upon in order to tackle the air quality issue:
Air pollution is not a seasonal problem faced only during the winters. Throughout summer, we barely saw any Good days even though the air quality was almost 50% better than previous years.
It takes two to six days of reduced economic activity to really start improving the air pollution situation in the city and hence long term solutions instead of one-off air quality improvement events should be prioritized.
While we have to tackle seasonal issues like crop burning, firecrackers as well as industrial emissions, public transport, vehicular emissions, construction dust etc., even when we take all these out almost completely we are still not meeting the required levels set by WHO (at 10 μg/m3) or even Indian Govt. at (30 μg/m3).
Unmonitored issues like waste burning, power generation, gensets, biomass burning for cooking, vehicular traffic for essential logistics which were still happening during lockdown clearly need to be tackled to really get air quality to healthy levels.
Do you think the data from Delhi can be used as a sample to find long term solutions for air pollution, by observing trends and patterns? What immediate measures can be taken by governing bodies, to bring down air pollution levels in 2021? What is the role of citizens in solving air pollution in India? We would love to hear your thoughts in the comments below.
About the author
Airveda team is a group of individuals working tirelessly with a mission to help people breathe well and live well.