Unveiling the Truth Behind Delhi NCR’s Winter Smog
Introduction
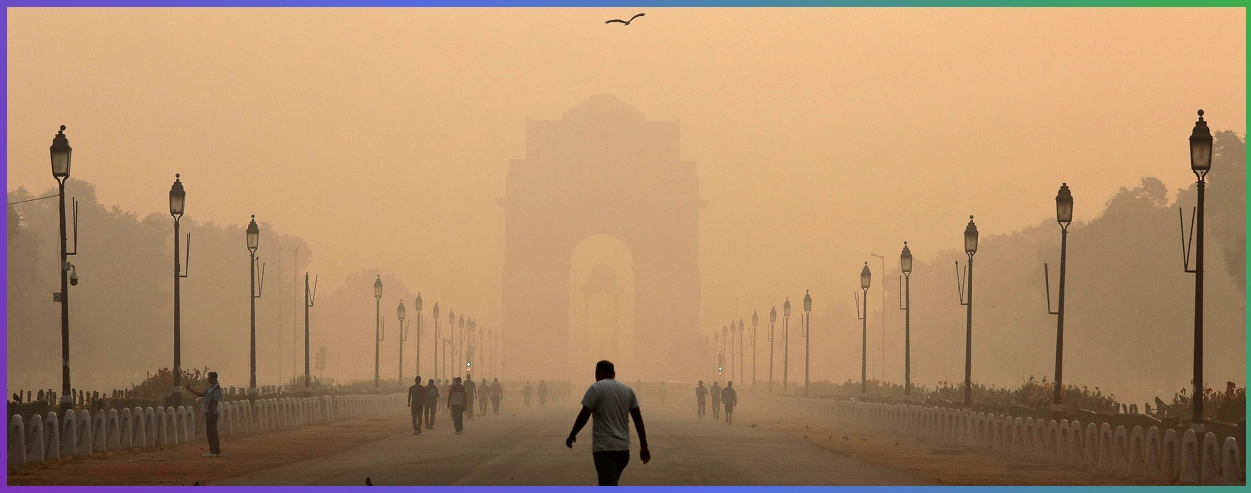
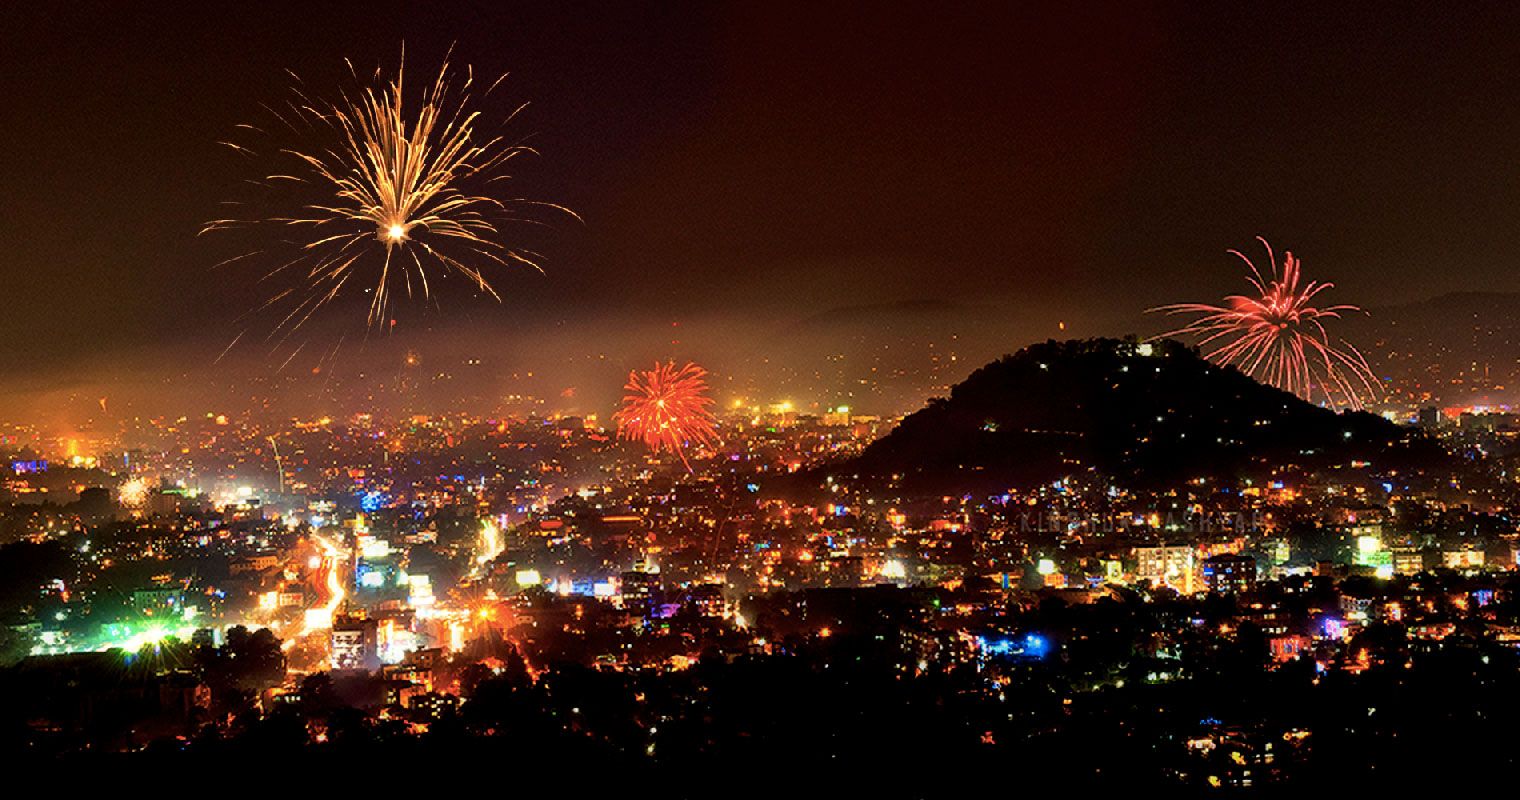
Every October, as festive lights begin to twinkle across North India, a familiar unease settles in. The evenings grow cooler, the skies turn hazy, and the Air Quality Index (AQI) creeps from Moderate to Severe almost overnight. Families switch on air purifiers, schools restrict outdoor play, and headlines warn of another “air emergency.”
Yet beneath this familiar pattern lies a deeper story one written by the atmosphere itself. But here’s the truth: this isn’t a sudden or mysterious event. The severe AQI spike that blankets cities like Delhi, Gurugram, Faridabad, Noida, and Chandigarh in October–November isn’t caused by a single day of fireworks or one pollution source. It’s the result of a predictable and powerful convergence of multiple factors: a perfect storm that builds slowly and traps pollution over the northern plains for weeks.
At Airveda, we’ve spent years tracking this seasonal pattern through real-time data, sensors, and satellite maps. Understanding why it happens is the first step to protecting yourself and taking control of the air you breathe.
Here is what the October data tell us.
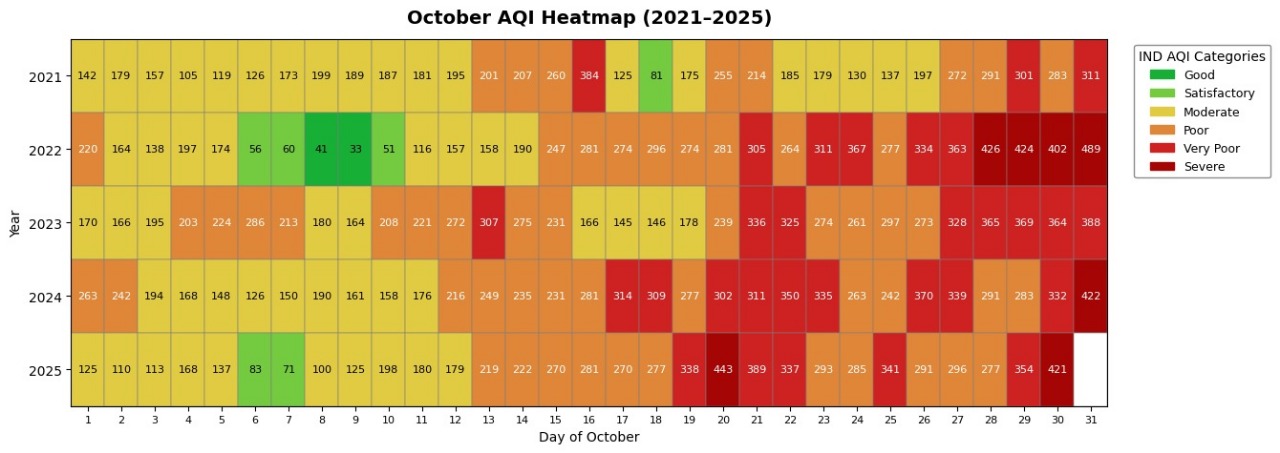
AQI across the October month.
🌾 The Stubble Burning Plume
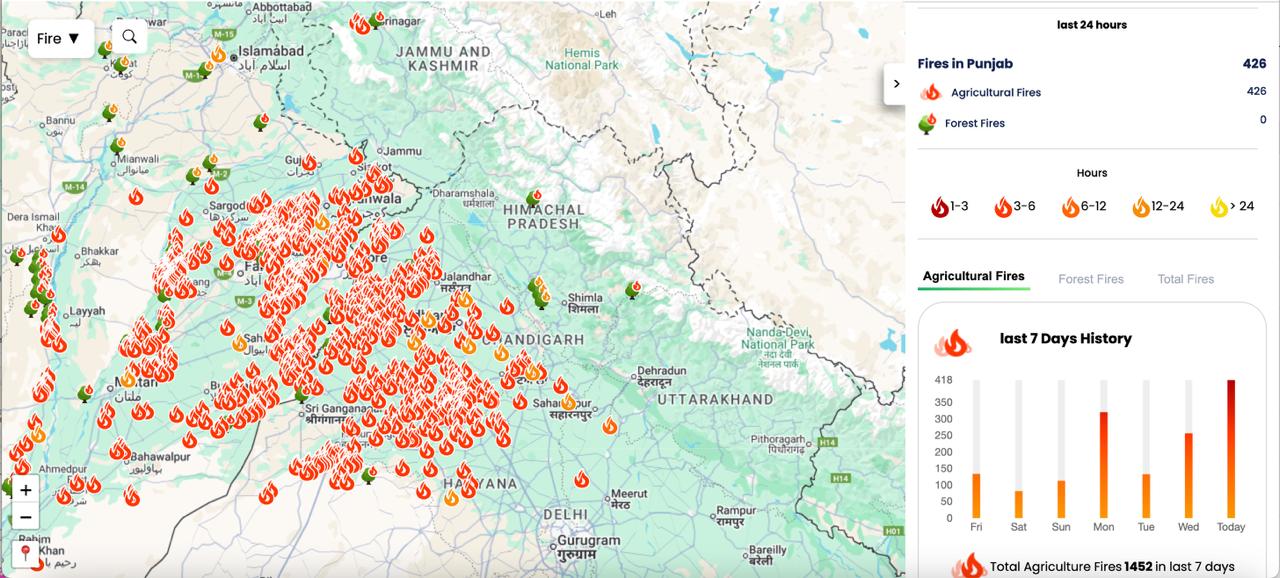
Each year after the paddy harvest in UP, Punjab and Haryana, farmers face a challenge: how to quickly clear leftover straw before the next wheat crop. Because manual removal is expensive and time-consuming, many resort to stubble burning, setting fire to crop residue across thousands of acres.
This practice releases massive quantities of fine particulate matter (PM₂.₅) and smoke, which drift downwind with northwesterly winds, blanketing Delhi-NCR in a grey haze that lingers for days.
To help citizens visualize this invisible movement, Airveda’s live map integrates NASA’s satellite fire hotspot data, allowing users to see in real time where crop fires are burning and how those plumes are affecting their local AQI. It’s one of the few tools that make the connection between distant farm fires and your city’s air tangible and immediate.
🌬️ The Meteorological Trap
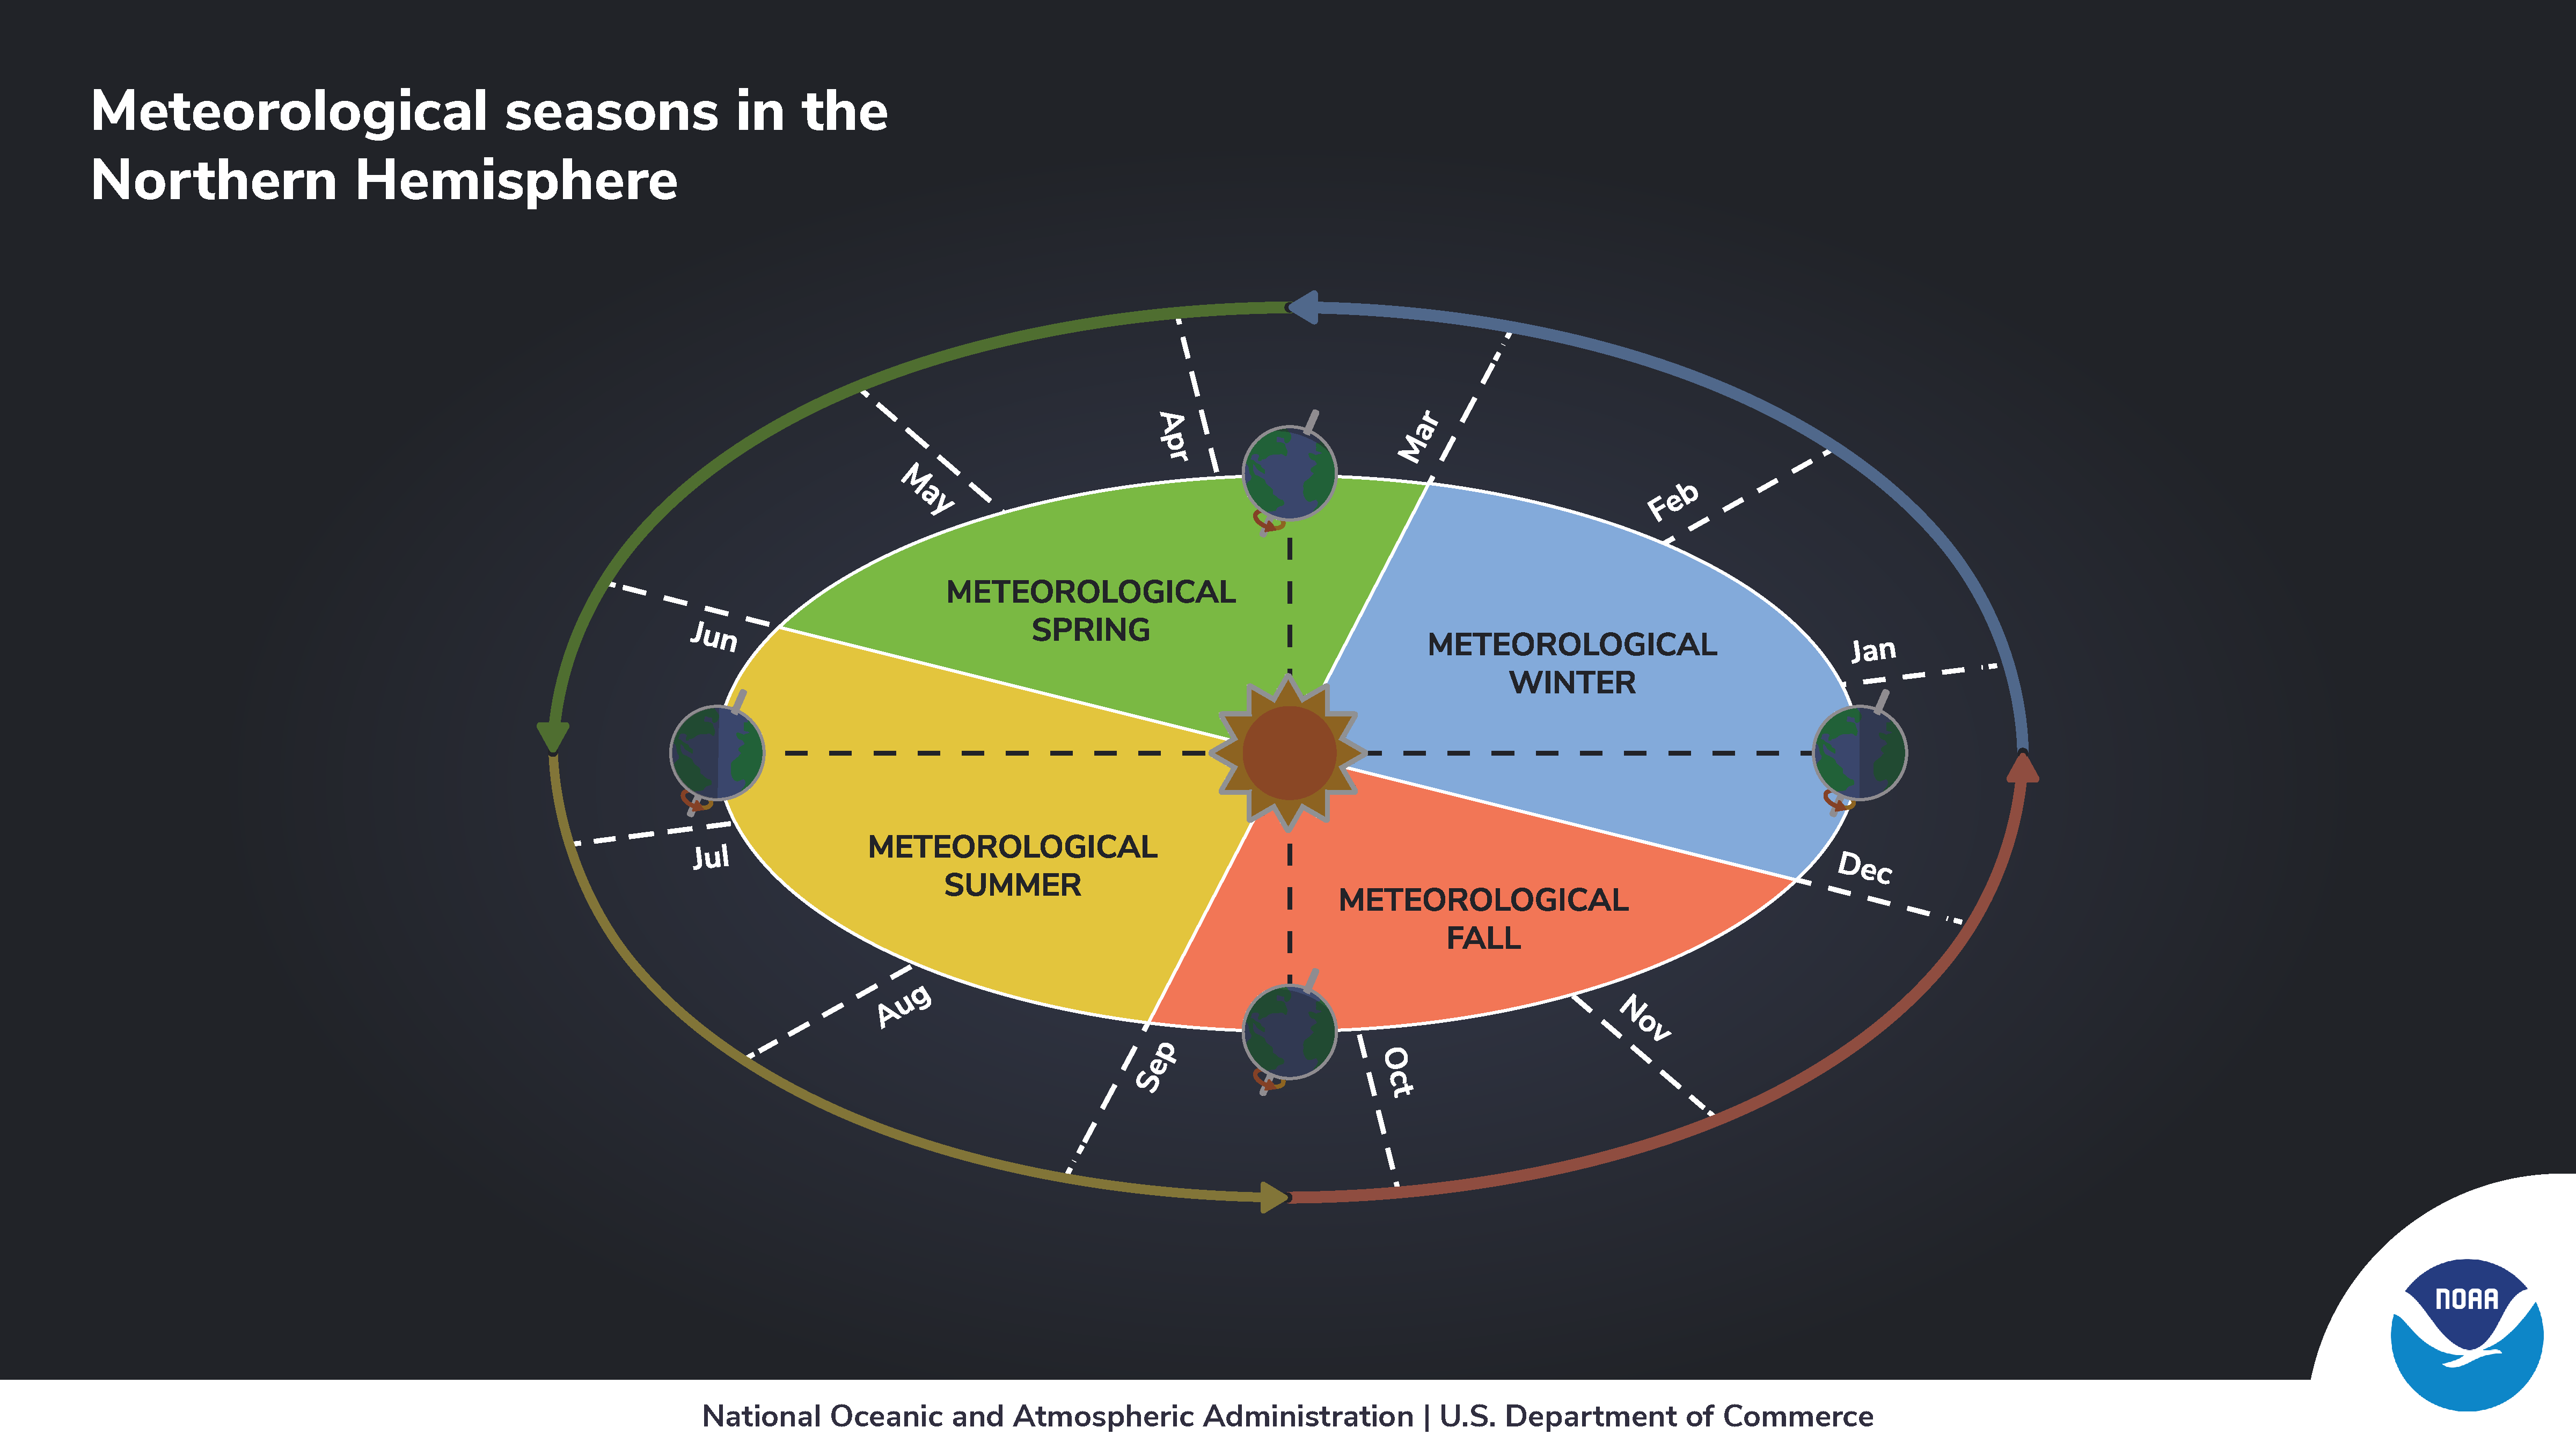
Even if emissions stay constant, autumn and early-winter weather itself becomes a powerful accomplice. Here’s how the atmosphere flips from a friend to a foe.
🌡 During the Normal Condition (No Inversion)
During the daytime, the sun heats the Earth’s surface, and the warm ground heats the air above it.Warm air is lighter (less dense), so it rises, carrying pollutants upward and allowing them to disperse into the upper atmosphere.This vertical mixing keeps air cleaner near the surface.
❄ During the Inversion Condition (Winter Problem)
In winter, the situation flips and an inversion layer forms, trapping pollution close to the ground.
Step-by-step science:
- At night, the ground cools rapidly because of radiative heat loss (the Earth emits heat back to space).
- The air just above the ground also cools by contact, but the upper air stays relatively warmer.
- This creates a temperature inversion instead of the normal decrease of temperature with height, temperature increases with height for a few hundred meters.
- The cool, dense air at the surface cannot rise through the warm air above it.
- The warm layer acts like a lid, preventing the vertical movement of air (convection stops).
- As a result, pollutants from vehicles, industries, crop burning, and dust remain trapped near the surface.
🌆 Why It’s Especially Bad in Delhi
Several local and regional factors amplify the problem:
- Geography: Delhi lies in the Indo-Gangetic plains, surrounded by the Aravalli hills to the west and Himalayas to the north. This blocks wind flow and traps air.
- Low wind speeds in winter mean little horizontal dispersion.
- High humidity and fog condense around particulate matter (PM₂.₅ and PM₁₀), forming smog.
- Widespread emissions vehicles, biomass burning, diesel generators continuously add pollutants to this trapped air.
- Nighttime inversion often persists into the morning hours because the low winter sun takes longer to warm the ground enough to break the inversion.
NASA Earth Observatory and India Today reports confirm this “winter lid” effect, worsened by the bowl-like topography of the Indo-Gangetic Plain, which prevents air from dispersing northward.
🎆 The Urban Load and the Festive Spike
While rural smoke and stagnant weather set the stage, urban emissions sustain the crisis.
Vehicles, factories, construction sites, and road dust continuously pump PM₁₀ and PM₂.₅ into the air. Under normal conditions, these pollutants would disperse gradually. But when the atmosphere is sealed by inversion, even everyday emissions accumulate into a dense, toxic haze. Remember the time when everything came to a halt and the air quality became so clean & clear that wildlife took over the streets.
Then comes Diwali. Firecrackers add a sharp but short-lived spike to an already overloaded system. The key point is this: Diwali doesn’t cause the crisis, it amplifies it.
📖 Read more: Diwali in COVID blog
While firecracker emissions are temporary, lasting only a few days, how long that pollution stays depends entirely on weather conditions.
- If strong winds blow or rain occurs, the spike can disperse in a day or two.
- But if the air is still and dry, smog can linger for a week or more.
- Sometimes, poor wind speed or persistent inversion means pollutants remain trapped for several weeks.
In short, we are at the mercy of meteorology. Good wind disperses, rain cleanses but in its absence, we get stuck breathing the same polluted air for days.
Sources: Nature Communications, Princeton Environment News
Still, celebration and sustainability can beautifully coexist.
💡 Breathable Diwali Ideas
✨ Light diyas, candles, and LED lights instead of fireworks.
🌕 Host a community lantern or laser-light show.
🍬 Bake sweets, play music, and create memories indoors.
🌿 Gift air-purifying plants like areca palm or peace lily to loved ones.
Read more: Fun-Ways-To-Celebrate-a-Firecracker-free-Diwali
🏙️ Local Pollution: The Everyday Load We Overlook
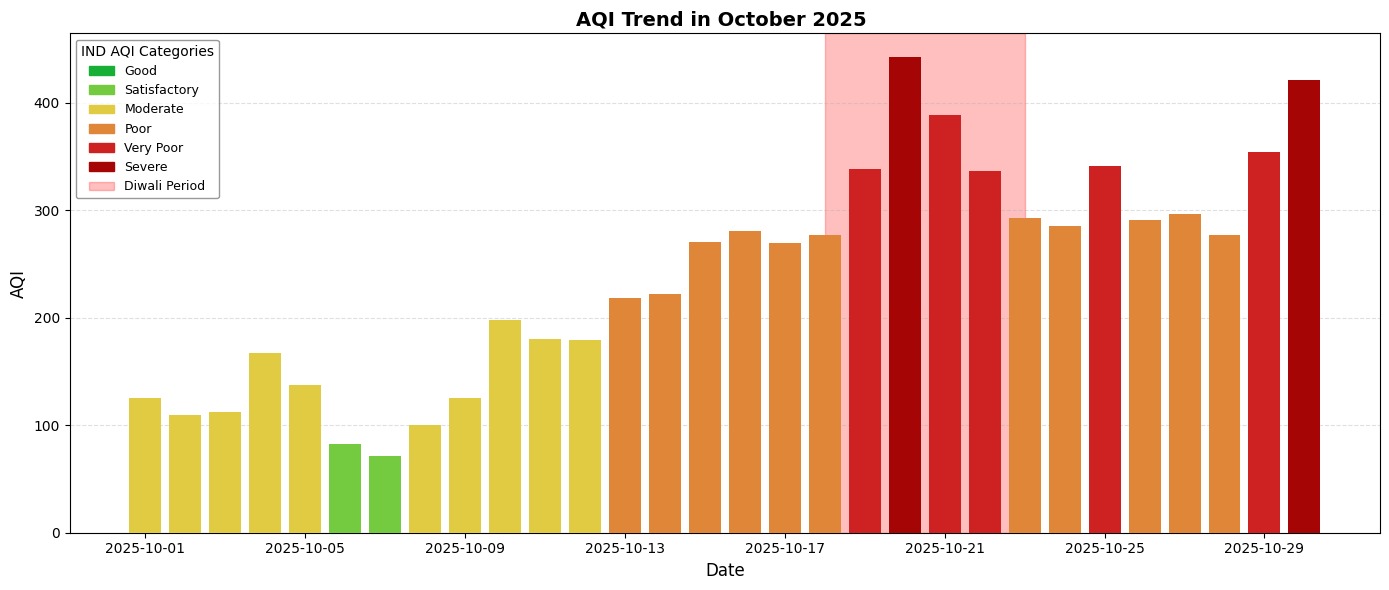
AQI trend peaking sharply in late October 2025 (Airveda Monitoring Network).
Beyond stubble burning and festive smoke, our cities themselves are major contributors to poor air quality.
Exhaust from vehicles idling in traffic, dust from ongoing construction, industrial emissions, road dust, and biomass burning all add to the pollution burden.
As temperatures drop, many people in low-income communities also light small fires outdoors to stay warm further raising PM₂.₅ levels.
These everyday sources operate quietly but steadily, and under winter inversion conditions, even “normal” emissions can push air quality into the hazardous range.
📊 Taking Control: How Airveda Helps You Breathe Smarter
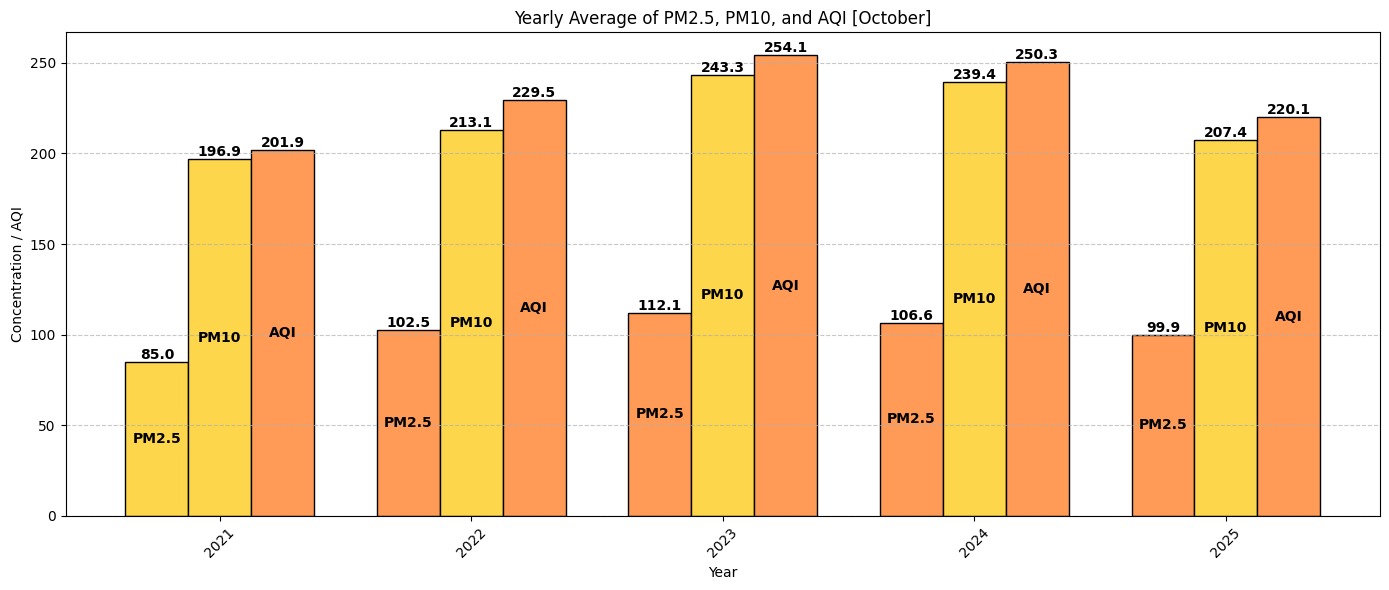
Yearly average of PM2.5, PM10 and AQI for the month of October.
While this “perfect storm” may seem overwhelming, technology empowers us to respond intelligently. Airveda gives individuals, families, and policymakers the tools to understand and manage air quality in real time.
But beyond daily alerts, data also helps us see the bigger picture of how our environment behaves year after year. By analyzing five years of AQI readings of October. Airveda’s monitoring network reveals a consistent and alarming trend: each year, pollution peaks sharply in late October to mid-November, coinciding with the stubble burning season and the onset of winter inversion
This isn’t random; it's data-driven evidence of what millions experience every year: a predictable smog season shaped by climate, geography, and human activity.
- Real-Time, Hyper-Local Data
- Compliance During GRAP & Regulatory Mandates
- Historical Data & Trend Analysis
- Live Fire Hotspot Map
- Smart Alerts
Airveda’s smart monitors deliver precise, real-time readings of PM₂.₅, PM₁₀, temperature, and humidity giving you an accurate picture of both indoor and outdoor air.
Airveda’s DPCC-approved devices help construction proponents stay updated during GRAP restrictions enforced by CAQM across Delhi-NCR, ensuring compliance and avoiding penalties.
Compare AQI trends over days, weeks, or even years to plan ahead for high-risk days and track how air quality deteriorates through October–November.
Integrated NASA fire data lets you visualize the connection between northern crop fires and your local pollution making the invisible, visible.
Set custom notifications when AQI crosses your safety threshold. Get instant prompts to close windows, turn on purifiers, or wear masks before exposure becomes harmful.
🌏 From Awareness to Action
North India’s winter air crisis is complex born from agricultural, meteorological, and urban realities that collide each year. But it’s not inevitable.
By combining real-time monitoring with historical insight, we can begin to predict, prepare, and protect ourselves better each season.
With the right mix of awareness, community participation, and data-driven monitoring, we can work toward cleaner air together.
At Airveda, we believe that what gets measured can be managed. Every data point, every alert, and every conscious choice brings us closer to clearer skies.
👉 Check your local AQI now on the Airveda App or Web Map.
👉 Explore our range of indoor and outdoor air quality monitors at airveda.com.
Don’t wait for the smog to settle take control of the air you breathe.

About the author
Priya Kumar is an Airveda team member passionate about air quality, sustainability, and public health. She contributes to content that helps raise awareness around air pollution and healthier indoor and outdoor environments.