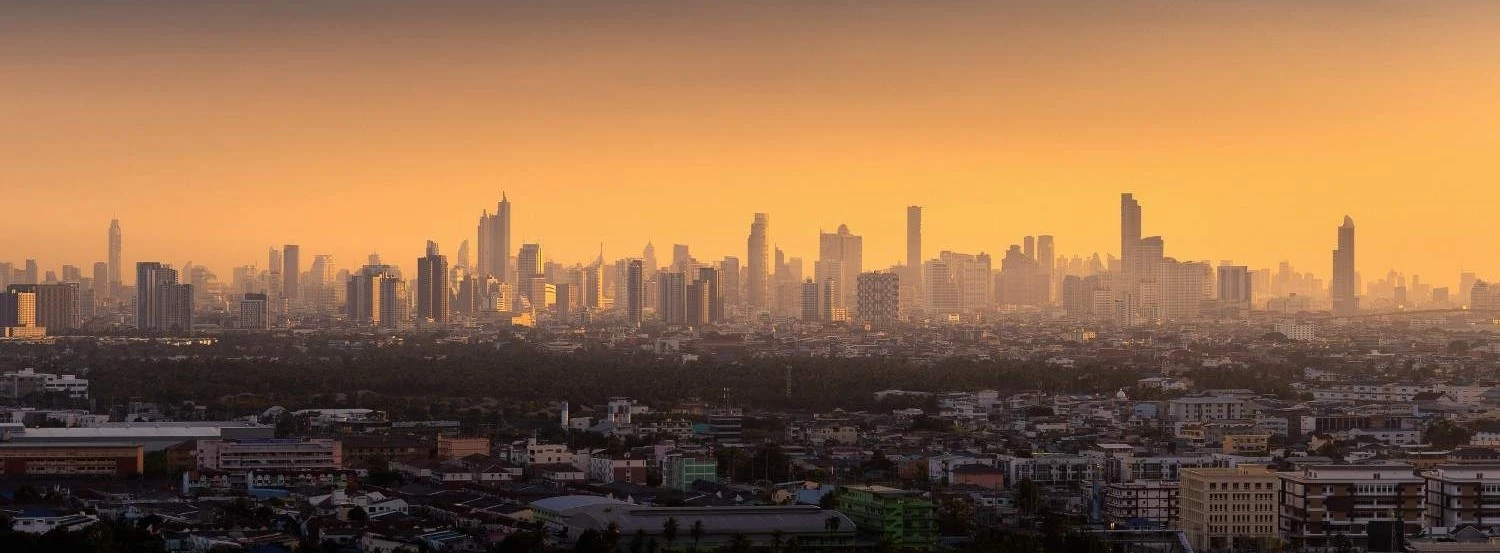
Gurgaon Pollution Trends: A Deep Dive into the Haze and Daze
Gurgaon, the bustling satellite city of Delhi, is notorious for its persistent air pollution. To tackle this pressing issue, Airveda has deployed 20 advanced monitors around Gurgaon in partnership with the Gurgaon Metropolitan Development Authority (GMDA) and leading industry players like Carrier, United way and Social Alpha. This extensive network allows us to capture detailed data on PM2.5 and PM10 levels, providing a comprehensive picture of the air quality across the city providing a comprehensive picture of the air quality.
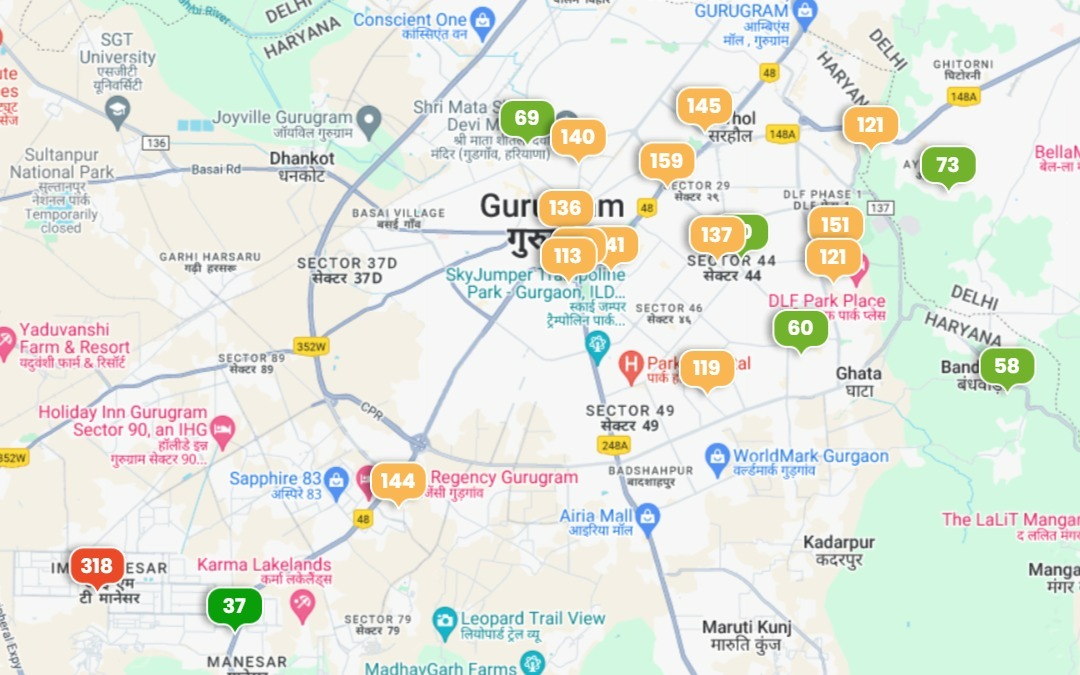
Below is a map showing the distribution of our air quality monitors across Gurgaon.
Insights Gathered from Our Data
While several sensors from the network have been operational for over 3 years now, here we share insights from the PM2.5 and PM10 levels captured by the network for the time period from February 2023 to January 2024. Let’s delve into some key insights from our data, noting that these observations are based on the data gathered and should be interpreted as data informed indications rather than definitive conclusions.
But First things first, lets understand what PM2.5, PM10 and AQI are.
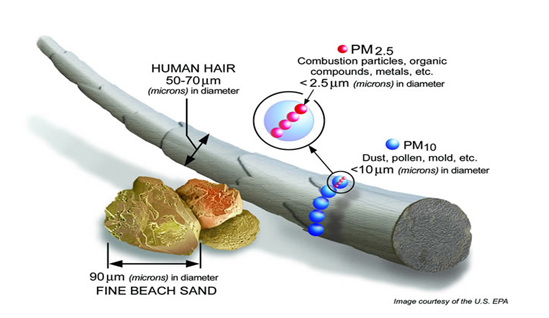
Understanding PM2.5, PM10, and AQI
PM2.5 refers to tiny particles in the air that are 2.5 micrometers or smaller in diameter, about 30 times smaller than the width of a human hair. These particles can penetrate deep into the lungs and even enter the bloodstream, posing serious health risks. PM10 particles are slightly larger, up to 10 micrometers in diameter, and can also cause respiratory issues and other health problems.
The Air Quality Index (AQI) quantifies the overall air quality in a specific area. It considers various pollutants, including PM2.5 and PM10, as well as ozone, sulfur dioxide, and nitrogen dioxide. The AQI provides a standardized way to communicate air quality and its potential health impacts. AQI values typically range from 0 to 500, with lower values indicating better air quality and higher values indicating poorer air quality. Different AQI categories, such as "Good," "Moderate," "Unhealthy," and "Hazardous," correspond to different ranges of AQI values and provide guidance on appropriate actions to protect public health.
Navigating Gurgaon's Hourly Air Quality Variations
Did you know that air quality fluctuates hourly throughout the day? An intriguing pattern emerges in PM levels between 1 PM and 4 PM every day. During these hours, PM levels plummet, offering a breath of fresh air in the midst of Gurgaon’s pollution woes. But why does this window of respite occur?
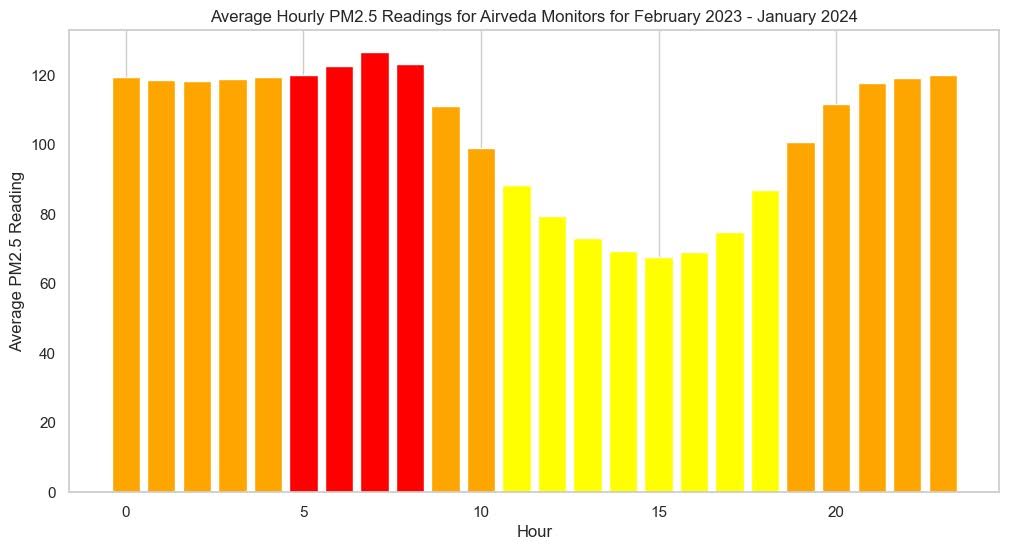
The answer probably lies in the convergence of two factors: peak temperatures and non-rush hours. As the sun reaches its peak during the early afternoon, temperatures soar, creating ideal conditions for the dispersion of pollutants. Additionally, non-rush hours mean fewer vehicles on the roads, leading to a reduction in vehicular emissions—a significant contributor to PM2.5 levels in urban areas. Looking for the best time to take your kids to the park or for an afternoon walk/run? This is a good time for some outdoor fun! This is also a good time to ventilate your houses and let some fresh air that is relatively cleaner come into your homes.
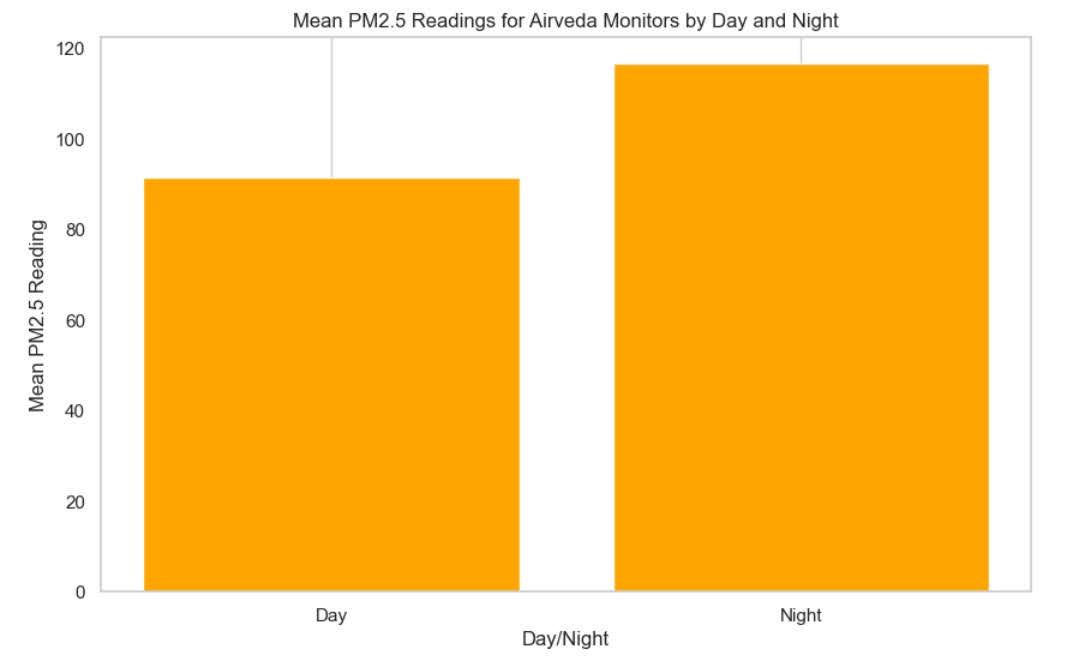
Day vs. Night PM2.5 Levels: Nighttime Nuisance
As the sun sets and darkness descends upon Gurgaon, a different challenge emerges—nighttime pollution. Our data reveals a notable spike in PM2.5 levels during the night, painting a troubling picture of nocturnal air quality. Cooler temperatures at night contribute to a decrease in atmospheric mixing, causing pollutants to stay closer to the ground. Emissions from heating systems and heavy-duty vehicles further add to the pollution burden, creating a perfect storm of nocturnal nuisance.
For night owls and late-night commuters, it is better to keep windows shut during this time to reduce exposure to harmful pollutants. Clean air is crucial for a restful and healthy night’s sleep. If you use air purifiers, it is a good idea to turn them on at night, as this can significantly reduce your overall exposure to pollutants during some of the most polluted hours of the day.
Weekday vs. Weekend PM Levels: Understanding the Dynamics
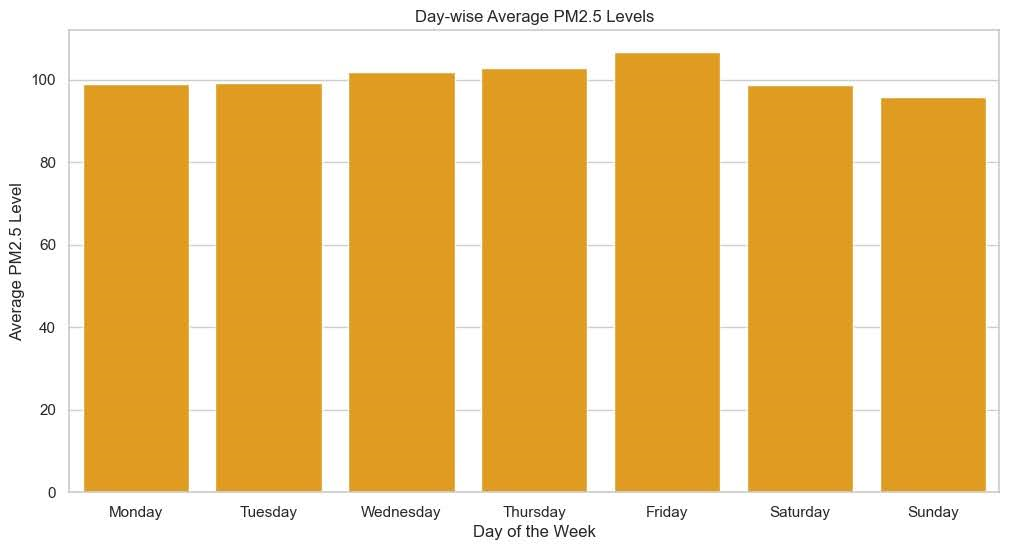
Weekdays: The Urban Hustle
Traditionally, Gurgaon witnesses marginally higher PM2.5 levels on weekdays compared to weekends. This trend is intricately tied to the routine hustle and bustle of urban life. Increased vehicular traffic, industrial activities, and commercial operations contribute to elevated pollution levels during the workweek. The daily grind of commuting, office hours, and business operations collectively contribute to a steady rise in particulate matter in the air.
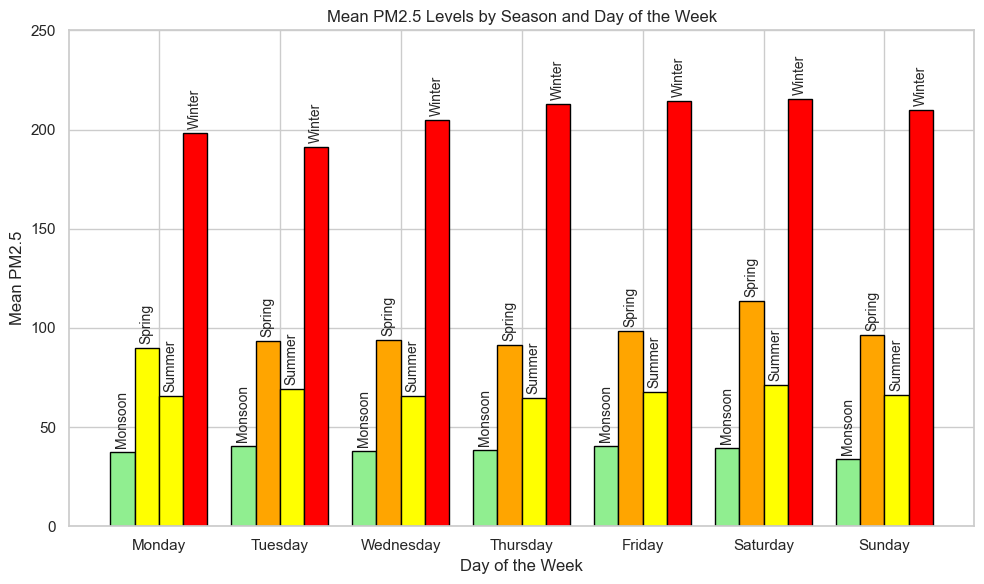
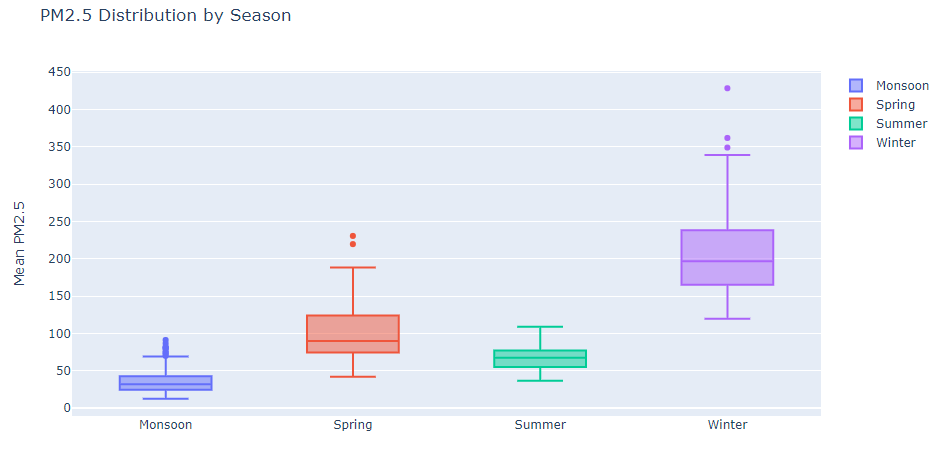
Seasonal Variations: Winter Woes and Monsoon Relief
The seasonal ebb and flow of PM levels reveal intriguing patterns. According to the data during the balmy days of summer and the rainy months of the monsoon, PM2.5 levels exhibit a relatively consistent pattern, with minimal variance between daytime and nighttime readings. However, winter paints a different picture—a rollercoaster ride of fluctuating pollution levels.
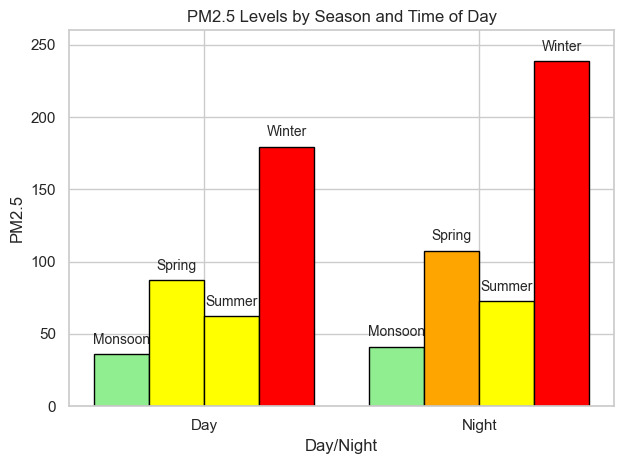
With the onset of winter, the mercury takes a nosedive after sunset, plunging temperatures to chilly lows. This temperature seems to drop leading to the trapping of pollutants near the ground, leading to an increase in PM2.5 levels during the night. The contrast between daytime and nighttime pollution levels becomes stark, as the cloak of darkness shrouds the city in a veil of smog.
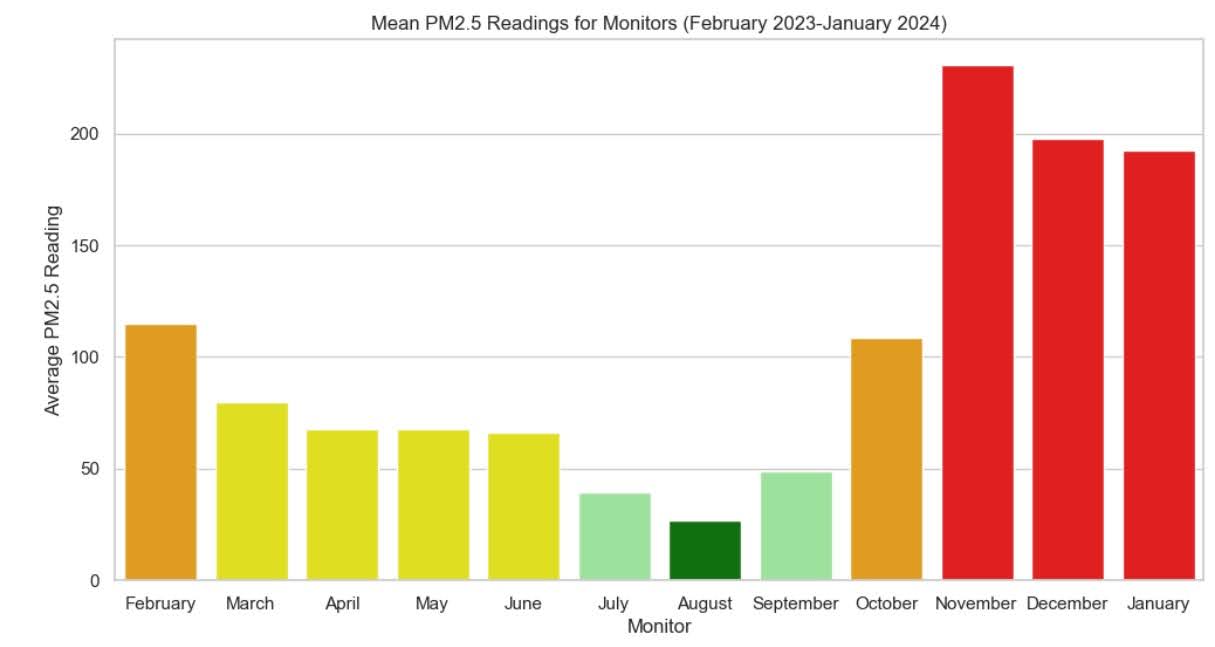
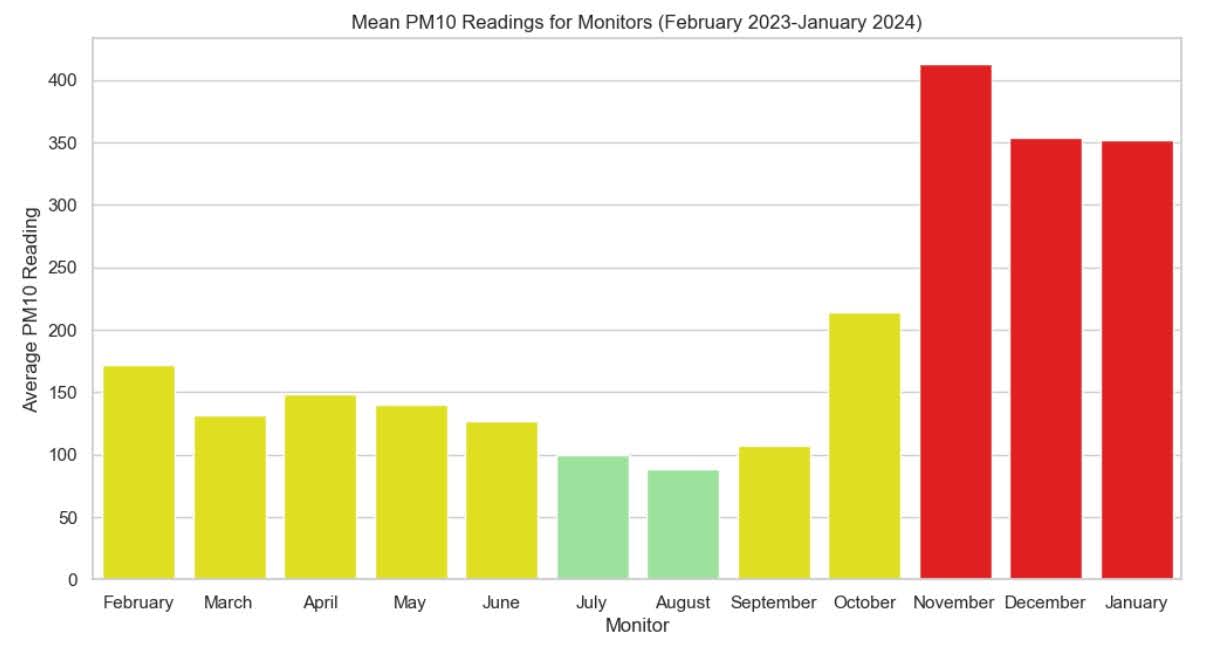
With the Winters comes the Smog! As our data shows, PM2.5 and PM10 levels peak during the winter months, particularly in November, where average PM levels are 800% higher than the month with the lowest reading (August). Stubble burning in Punjab and Haryana contributes significantly to these high levels in October. As temperatures drop, pollutants stay closer to the ground, trapping them in our atmosphere and making the air even dirtier.
A closer look at the monthly PM levels shows a clear trend: winter months consistently register higher readings. If you ever wonder why your morning jog feels like a marathon through smog in January. Well, the bad air quality is the reason.
Air Quality Standards: Good, Bad, and Ugly
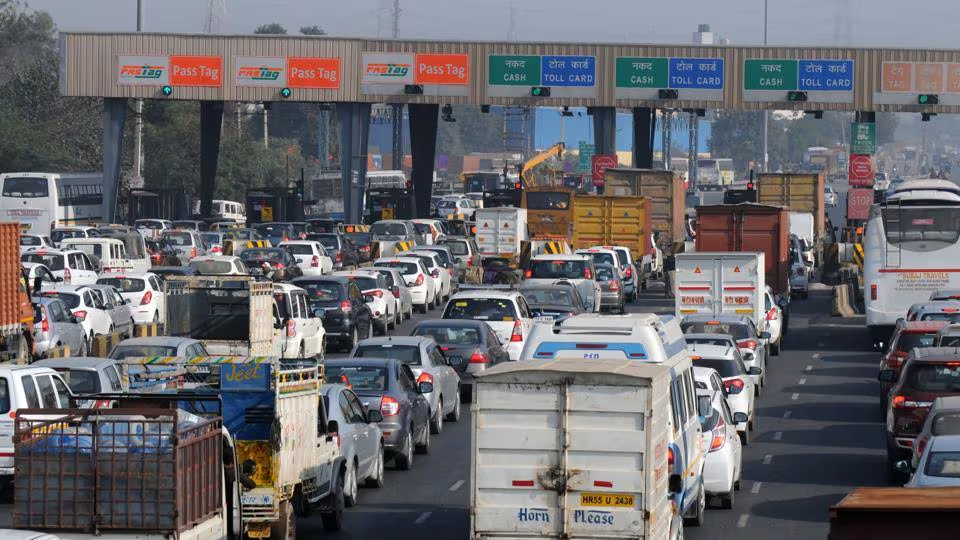
Top Polluters: Sector 51, Gurugram, and Kherki Daula Toll Plaza lead the pack.
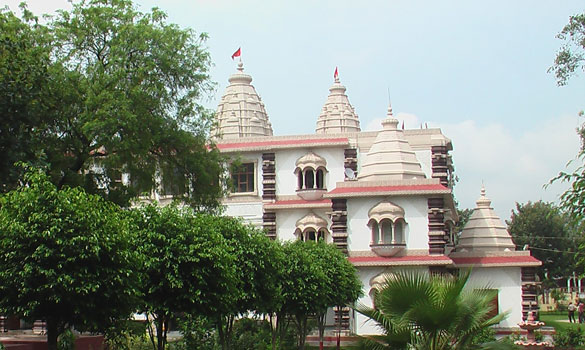
Conversely, areas around Sheetla Mata Mandir enjoy relatively cleaner air.
Factors like traffic congestion and industrial activities around these sites likely play a role.
Correlation Between Temperature and PM: Temperature Down, Pollution Up
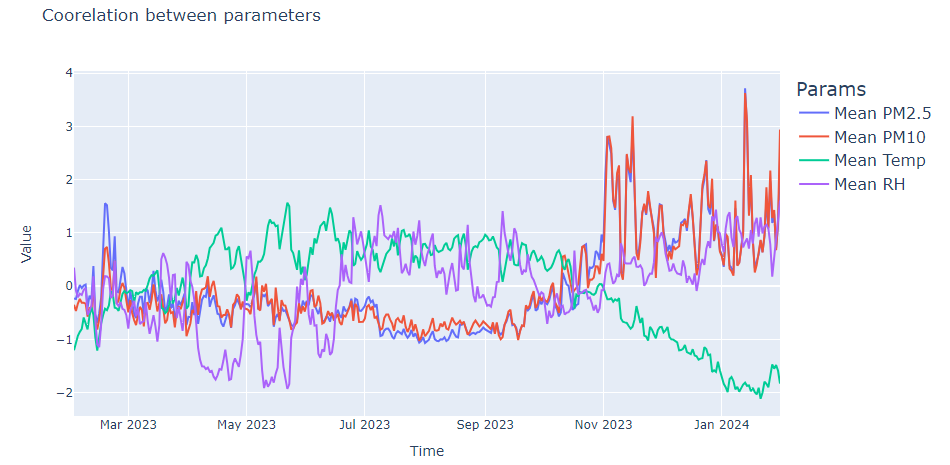
Our data reveals a striking correlation between temperature and PM2.5 levels—an inverse relationship that underscores the intricate interplay between climate and air quality. As temperatures drop, PM2.5 readings climb, painting a clear picture of worsening pollution conditions during colder weather.
When temperatures plummet, a phenomenon known as temperature inversion often occurs. This atmospheric condition traps pollutants near the surface, preventing them from dispersing into the upper atmosphere. Additionally, colder temperatures can exacerbate the effects of emissions from various sources, including vehicular exhaust, industrial activity, and biomass burning. As the air becomes colder and denser, these pollutants linger in the atmosphere for longer periods, leading to higher concentrations of PM2.5 and other harmful particulate matter.
Our Network: Powered by Collaboration
Our monitoring network in Gurgaon comprises sensors placed at 20 different locations, strategically selected to cover both residential and commercial areas. This initiative has been made possible through the generous sponsorship and support from Carrier, United Way, GMDA and Social Alpha. Carrier has sponsored eleven sensors across the city, enhancing our ability to track pollution levels in real-time and gather valuable data for analysis. Two of these monitors are collocated with Haryana Pollution Control Board reference monitors to ensure that we can continue to compare and calibrate our network based on regulatory grade sensors. Social Alpha has sponsored 8 additional monitors for 3 years as part of the India Clean Air Challenge (ICAC) grant where we were one of the winning startups. Support from GMDA (Gurugram Metropolitan Development Authority) has been invaluable in helping us deploy and maintain these sensors.
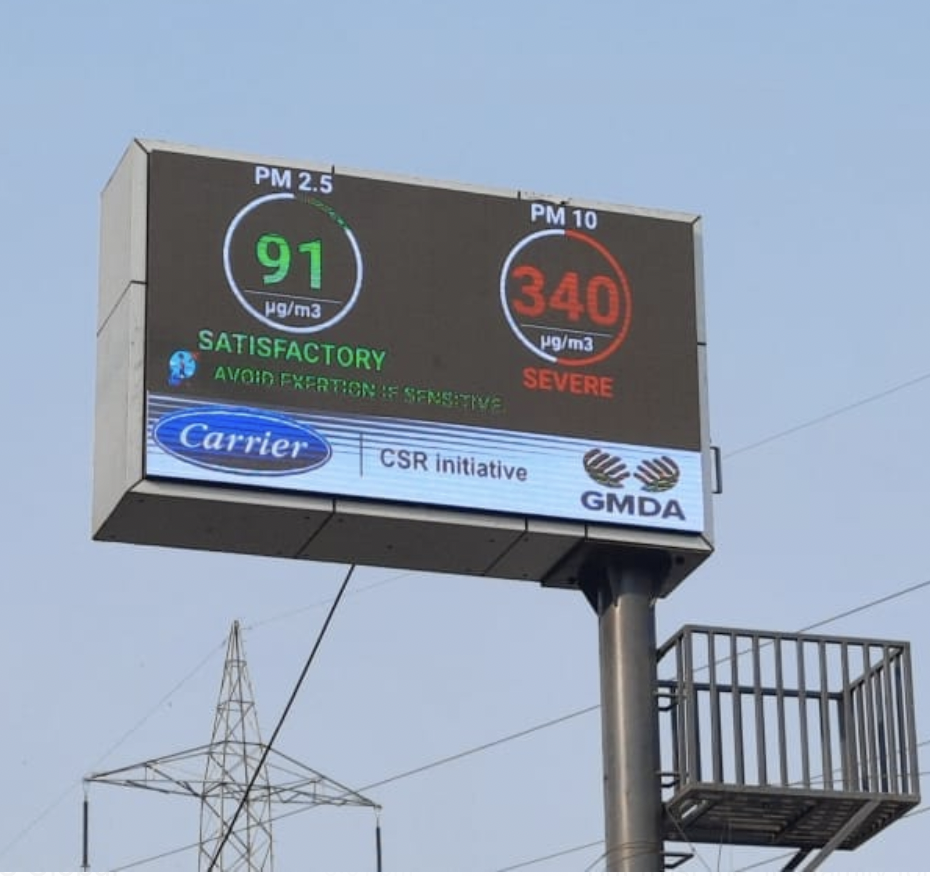
Carrier and United Way have helped place several LED Displays across Gurgaon which interface with our servers to display real-time air quality at these locations, giving Gurgaon residents much needed access to real-time air quality data while commuting through busy Gurgaon roads.
Conclusion: Navigating Gurgaon’s Air Quality
In the ever-changing landscape of Gurgaon's air quality, knowledge is our greatest ally. By understanding the intricate patterns and correlations revealed by our data, we take the crucial first step towards combating the city's persistent pollution problem. Armed with this understanding, we can embark on a journey of strategic planning and proactive measures aimed at safeguarding public health and environmental well-being.
From avoiding outdoor activities during peak pollution hours to advocating for better environmental practices and policy interventions, there is much we can do to mitigate the impact of pollution on our lives. By making informed choices and collectively striving for positive change, we can pave the way for a cleaner, healthier future for Gurgaon and its residents.
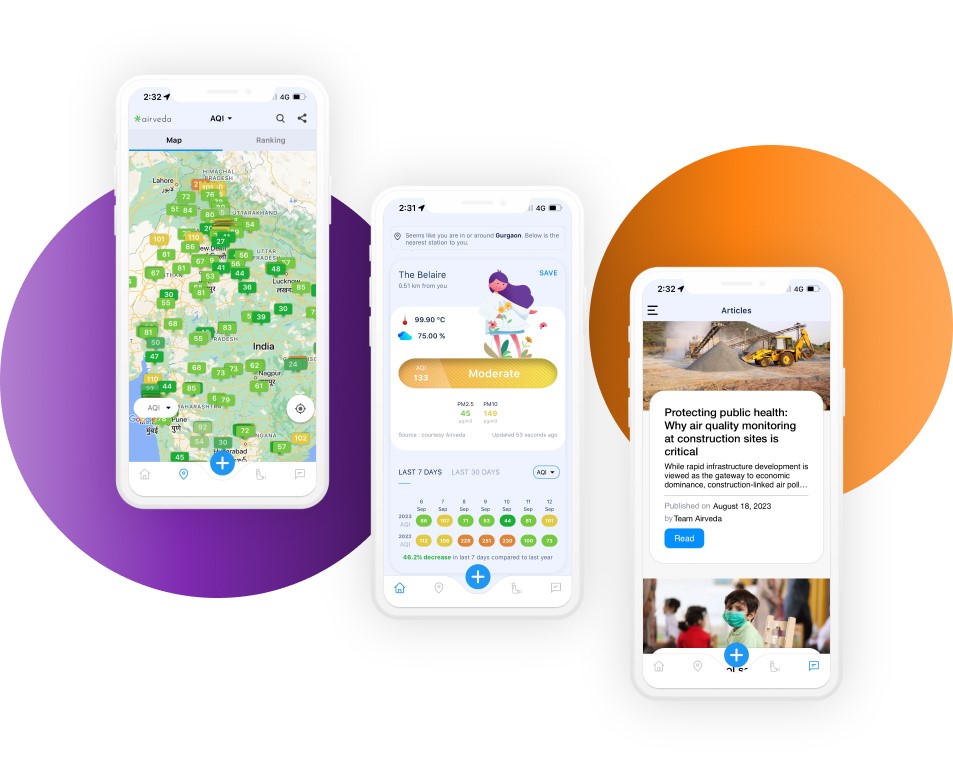
As the leading provider of air quality monitoring solutions, Airveda is committed to equipping you with the tools and insights needed to make informed decisions. To stay updated on real-time air quality data and receive personalized alerts, download our free Airveda app, available freely on iOS and Android. With the app, you can easily monitor the air quality in your area and plan your activities accordingly. Together, let's take control of our air quality and work towards a brighter, cleaner future for Gurgaon.
About the author
Airveda team is a group of individuals working tirelessly with a mission to help people breathe well and live well.